Abstract: cultivated land, fresh water and fossil energy are national strategic natural resources, which are related to national economy and people's livelihood. It is of great significance to study the resource endowment of countries along "Belt and Road" for the implementation of bilateral and multilateral cooperation under the framework of "Belt and Road", which is the basic prerequisite for promoting the smooth implementation of the "Belt and Road" initiative. This paper takes the countries along Belt and Road as the research object, takes the cultivated land resources, the fresh water resources and the fossil energy as the research contents, according to the main distribution characteristics and the basic situation of the countries along the "Belt and Road". The main conclusions are as follows: (1) The total area of cultivated land resources is abundant, the per capita resources are insufficient, the contradiction between man and land is severe, the industrialization urbanization promotes the cultivated land to be non-agricultural; (2) the countries along the route of "Belt and Road" are faced with the double contradiction between the shortage of cultivated land resources and the low grain production rate, which threaten the national food security; (3) the countries along the "Belt and Road" line have a serious shortage of freshwater resources available to them per capita. The wars caused by freshwater resources in the world mainly take place in the countries along "Belt and Road"; (4) the contradiction of water use in the countries along the "Belt and Road" line is prominent, the water productivity is low, and the agricultural water uses too much water resources; (5) countries along "Belt and Road" gradually become The production, consumption and trade center of fossil energy in the world; (6) the consumption structure of the countries along "Belt and Road" is dominated by the coal consumption for a long time and has a growing tendency, which makes the countries along the "Belt and Road" facing greater pressure of reducing carbon emissions; (7) the energy utilization efficiency of the countries along Belt and Road is low, and the potential of energy saving and consumption reduction is great.
Keywords: "Belt and Road" along countries; cultivated land resources; freshwater resources; fossil energy
The cultivated land resources of the countries along "Belt and Road"
Cultivated land is the foundation of the whole national economy, and cultivated land resource has an important influence on the economic development of a country. Cultivated land is the basis and guarantee of national food security and the basic guarantee of providing food. In recent years, with the rapid population growth, the problem of contradiction between man and land has become prominent, which has caused the world food security concerns. In September 2010, the World Bank published "Global concern for the growing cultivated Land", which has become the focus of global attention due to the impact of population growth, price fluctuations, environmental pressures, and whether cultivated land can meet human needs. The global attention to cultivated land has gradually increased [1]. Cultivated Land Resources of countries along "Belt and Road" Endowment and its existing problems affect the food security of the countries along the route of "Belt and Road". It is of great significance to study this problem for the smooth development of agricultural cooperation under the initiative of "Belt and Road".
I. the basic characteristics of cultivated land resources in the countries along "Belt and Road"
(1) . The total area of cultivated land in the countries along "Belt and Road" is abundant, but the per capita resources are short.
According to the world bank's criteria, the world's main regions are divided into seven parts, namely, North America, Latin America and the Caribbean, East Asia and the Pacific, Europe and Central Asia, sub Saharan Africa, South Asia, the Middle East and North Africa. Bo alliance, OECD and the European Union and other three regions. According to the data of the FAO, in 2013, the total cultivated land area in the world was 1 billion 410 million hectares, accounting for 6.81 of the total area of 10.85%. in 65 countries. 100 million hectares, accounting for 48.28 million hectares of the world's total cultivated land, accounting for almost half of the world's total. The largest cultivated land in the world is India, with 157 million hectares. Russia and China, on the other hand, ranked fourth in the world with 122 million hectares and 106 million hectares. China and Russia are also the major "Belt and Road" countries, and the countries along the "Belt and Road" line have highlighted their important position because they account for almost half of the world's cultivated land resources. But when population is considered, countries along Belt and Road lose the advantage of cultivated land.
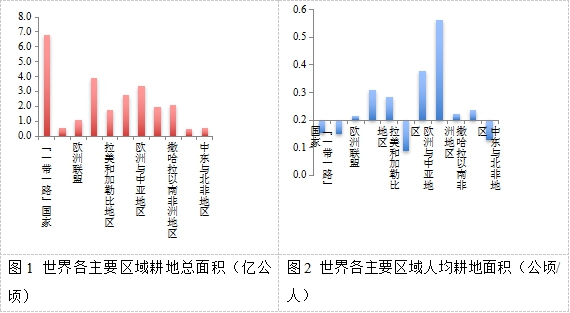
Source: world Bank WDI Database, 2013, Beijing normal University Research Institute of emerging Markets
(Fig.1: Total cultivated land in major regions of the world (100 million hectares);Fig. 2: Per capita cultivated area in major regions of the world (ha / person))
Figures 1 and 2 show the cultivated land resources in the major regions of the world, including the total cultivated land area and the per capita cultivated land area. We can see that the total cultivated land resources of the countries along the "Belt and Road" route far exceed those of other regions and organizations. However, the per capita cultivated land resources are lower than those of the OECD and the European Union, and the Arab League, South Asia, which is mainly involved in the "Belt and Road" countries, The Middle East and North Africa have very low per capita arable land resources.
In detail, figure 2 takes 0.197 hectares of arable land per capita in the world as the intersection point of the horizontal axis. The area above the horizontal axis is higher than the world average, and the area below the horizontal axis is below the world average. It can be seen from the figure that North America has the richest cultivated land resources in the world with a per capita cultivated land area of 0.562 hectares, followed by Europe and Central Asia. The area of cultivated land per capita in the countries along Belt and Road is only 0.152 hectares, which is lower than the world average. The most scarce cultivated land resources are in the Middle East and North Africa. The Arab League countries have a per capita cultivated area of 0.149 hectares. East and North Africa are 0.128 hectares, South Asia has a relatively high per capita cultivated area of 0.235 hectares. Only 29 countries along the "Belt and Road" line are higher than the per capita cultivated land area in the world, and more than half (55.38%) of the countries along the route are below the world average. Singapore has the lowest per capita arable land, accounting for 1.03 hectares per 10,000 people, followed by Bahrain (12 hectares per 10,000 people) and Kuwait (27 hectares per 10,000 people). China has a per capita cultivated land area of 771 hectares per 10,000 people, ranking 45th among the countries along the "Belt and Road" line. In a country with a shortage of cultivated land.
(2) . Low yield of cultivated Grain in the countries along "Belt and Road"
According to the definition of the Food and Agriculture Organization of the United Nations (FAO), grain yield refers to the grain tonnage per hectare of land harvested. These cereals mainly include wheat, corn, millet, buckwheat and so on. In addition, the grain harvest near the end of the year at the time of calculation is calculated in the following year.
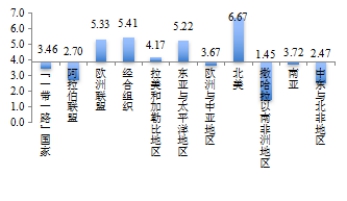
Fig. 3 Grain production in major regions of the world (tonnes / ha)
Source: world Bank WDI Database, 2014, Emerging Markets Institute, Beijing Normal University
As shown in figure 3, the world average grain production is 3.897 tons per hectare, which is the cross point of the horizontal axis, the area above the horizontal axis is higher than the world average, and the area below the horizontal axis is below the world average. The average grain production of the countries along Belt and Road is 3.456 tons per hectare, which is lower than the world average. Belt and Road's grain production in the Arab League, South Asia, the Middle East and North Africa is below the world average, while Europe and Central Asia are basically equal to the world average. Its Middle East and North Africa region produces only 2.473 tons of grain. / ha. Grain production in the developed regions of the world, such as North America, the European Union, the Organization for Economic Cooperation and Development and East Asia and the Pacific, is higher than the world average. North America is 6.670 tons per hectare, double the grain production of the countries along the "Belt and Road" route.
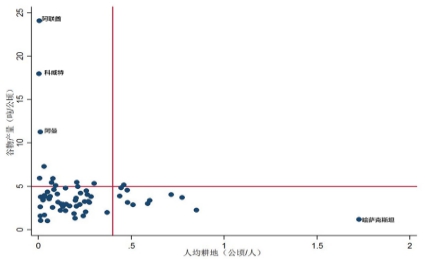
Fig. 4 Grain yield and per capita cultivated land area in countries along "Belt and Road"
Source: world Bank WDI Database, 2014, Emerging Markets Institute, Beijing Normal University
Figure 4 shows the relationship between grain yield and per capita cultivated land resources in "Belt and Road" 65 countries, in which two horizontal lines indicate grain production at a horizontal line of 5 tons per hectare and a line of 0.4 hectares per person per capita cultivated land area. This is divided into four quadrants. The first quadrant is an area with rich cultivated land resources and high grain production, the second quadrant is an area with scarce cultivated land resources but a high grain yield, and the third quadrant represents an area where cultivated land resources are scarce and grain yields are low. The fourth quadrant indicates areas with rich cultivated land and low grain yields. It can be seen from the figure that the countries along the route of "Belt and Road" are mainly concentrated in the The third quadrant, that is, the per capita cultivated land area changes around the world average level, the grain yield is less than 5 tons per hectare, which is faced with the dual problems of the lack of cultivated land resources and the low grain yield of cultivated land.
In the second quadrant, the United Arab Emirates, Kuwait and Oman, which are very short of cultivated land, produce very high grain production, producing 24.101 tons of grain per hectare of cultivated land, 17.965 tons and 11.254 tons of grain, ranking No. 1 and 34 in the world. However, the cultivated land resources in these areas are very scarce, desertification land is the majority, although the yield of grain is high, but the total grain output is not high, and the food is still mainly dependent on imports. The areas falling in the fourth quadrant are concentrated in the third quadrant. It should be noted, in particular, that Kazakhstan has the highest per capita cultivated land area and is at a leading level in the world. Cultivated grain production is low, at 1.165 tons per hectare, just above Yemen and Brunei in countries along Belt and Road. The planting area of crops in Kazakhstan is very large, but the yield per unit area is low, because of the scarcity of land, the extensive management mode is still retained. This kind of agricultural production in the initial stage of agricultural development reduces the economic benefit.
(3) . Most underdeveloped “Belt and Road” countries are short of farmland resources, and extensive operation leads to waste of resources
The transformation of agriculture from extensive to intensive was carried out along with the transformation of economic development from underdeveloped to developed countries. The fact that 70 per cent of the countries along Belt and Road are in middle-income countries show that agriculture in this region is undergoing an extensive and intensive transition period, most of which are at the stage of traditional agriculture. There is a considerable waste of resources in the use of cultivated land resources.
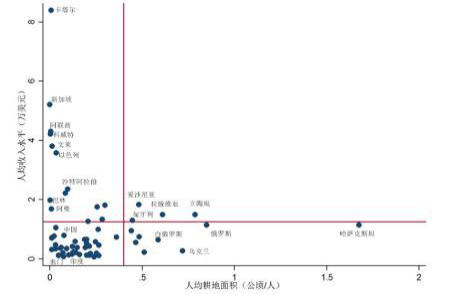
Fig. 5 cultivated land resources of "Belt and Road" in different income countries [2]
Source: world Bank WDI Database, 2014
This part analyzes the cultivated land resources of different income levels in the countries along Belt and Road, and studies the characteristics of cultivated land resources in the different income countries of Belt and Road. Figure 5 shows the cultivated land resources of countries with different economic levels along "Belt and Road". Two horizontal lines represent a per capita income level of US $12500 and a vertical line represents a per capita cultivated area of 0.4 hectares. Take the world per capita cultivated land level 0.2 hectares as the reference, above the horizontal line for entering the developed level, below the horizontal line is the developing country, the vertical line left side is the per capita cultivated land level near the world average level, relatively lacks, the vertical line right The side is rich in per capita cultivated land, which is divided into four quadrants. The first quadrant is a high-income country with a high per capita cultivated land area, the second quadrant is a high-income country with a low per capita cultivated land area, the third quadrant is a low-income country with a low per capita cultivated land area, and the fourth quadrant is a low-income country with a high per capita cultivated land area. It can be seen from the figure that most of Belt and Road's countries fall in the third quadrant or close to the third quadrant, indicating that the cultivated land resources of the "Belt and Road" countries are in the state of low per capita cultivated land level and low income level.
The first quadrant (high-cultivated land, high-income) countries are mainly Lithuania, Latvia, Estonia and Hungary. According to World Bank statistics in 2015, Lithuania has a per capita cultivated area of 0.787 hectares, ranking seventh in the world. Latvia is 11th in the world with 0.611 hectares, Estonia has 0.482 hectares of arable land per capita, and the United States (0.472 hectares), followed by Hungary with 0.447 hectares. The smaller size of the population in this part of the country has led to a relatively high per capita cultivated area, none of which is more than 100 million, with Estonia only having a population of 100 million. 1.31 million, Latvia 1.98 million, Lithuania 2.91 million, Hungary has a relatively large population of 9.84 million. At the same time, these countries are all developed capitalist countries, with high per capita living standard, rapid economic development and intensive land use, which are rich in cultivated land resources in the countries along "Belt and Road".
The second quadrant (low-cultivated land, high-income) countries are mainly Qatar, Singapore, the United Arab Emirates, Kuwait, Brunei, Israel, Saudi Arabia, Slovenia, Bahrain, Oman, Croatia, the Czech Republic, Slovakia, Countries such as Poland are high-income countries with relatively low per capita arable land. The main reason for the low per capita cultivated land in these countries is not because of the high population density, but because the proportion of cultivated land in the land area is too small. These countries have a huge desert area and a serious shortage of fresh water resources. Oman 0.12, UAE 0.45, Kuwait 0. Singapore 0.81, Brunei 0.95, Qatar 1.22, Saudi Arabia 1.43, Bahrain 2.08. Limited by the area of cultivated land, the agricultural production structure of these countries is focused on raising-animal husbandry and horticulture, most of the grain and agricultural raw materials depend on imports, agricultural and animal husbandry products can not be self-supporting, grain, vegetables, fruits, meat, eggs and milk mainly rely on imports. Because these countries have developed economies and are fully capable of importing essential food and other necessities of life, the living standards of their people are very high.
The third quadrant (low arable land, low income) is the quadrant of the main concentration of countries along "Belt and Road." this category of countries accounts for 40 countries, accounting for 62% of all the "Belt and Road" countries. Such countries include China and India. Most Asian countries, including Indonesia, Laos, Nepal, Myanmar, Bhutan, Afghanistan and other countries, are still economically developing, with less arable land per capita and low agricultural skills. This kind of country is mainly restricted by two factors, such as economic condition and insufficient reserve resources, which make the contradiction of the shortage of cultivated land more acute. The reason for the lack of arable land per capita is, on the one hand, arable land On the other hand, the proportion of land area is small, on the other hand, population density is high. The level of grain yield per mu is very low, and half to two-thirds of the economically active population is still tied to land. The economically active population engaged in agricultural production is very high, of which 66.45% are employed in agriculture in Laos, 64.33% in Nepal, 57.63% in Myanmar and 54.63% in Bhutan. 49%, Afghanistan 52.95%, and so on. The industrialization and urbanization level is low. As the world's important food exporters, the proportion of the agricultural population in employment in the United States, Australia, Canada is 10.22%, 2.79%, 2.11 respectively. The industrialization level is high, agricultural intensive development. In the third quadrant of the country, the number of people supported by each economically active agricultural population is very small. Nepal supports only 2869 people per agricultural worker, Laos 3029, Myanmar 3222, Vietnam 3719 and Bhutan 3879. Comparatively, The United States, a major food exporter, supports 6857 people per capita, Australia 72065, and Canada 91958.
The fourth quadrant (high cultivated land, low income) countries are mainly Kazakhstan, Russia, Ukraine, Belarus and other countries. The per capita cultivated land level of these countries is very high, but the intensive level of land use is the lowest, and the level of agricultural technology is low. The amount of cultivated land per capita is much higher than the world average. In order to meet the needs of population explosion, the total area of cultivated land has obviously expanded, but it is widely planted and harvested. In particular, Kazakhstan is rich in per capita cultivated land resources, but the proportion of agricultural added value is only 4.97. Kazakhstan has a vast land area, a small population, insufficient labor force and drought and water shortage, so the country's agriculture has been in extensive management for a long time. The state of This part of the country occupies "Belt and Road" high proportion of cultivated land area, and extensive management caused the waste of cultivated land resources. The rich cultivated land resources have made Kazakhstan have great potential in agriculture. Nazarbayev has pointed out that Kazakhstan has great agricultural potential and called on China to invest and develop agriculture in Kazakhstan. Agriculture is a traditional strong area in Kazakhstan, but the low utilization rate of land restricts its agricultural development. Today, the world is actively developing land and vigorously developing agricultural products processing industry. Kazakhstan has 9 million hectares of land undeveloped. Jandosov, the former deputy prime minister of Kazakhstan, made the same point on December 11, 2016, at the lecture hall of "Belt and Road" in Beijing. [3] This may be the "Belt and Road" initiative to promote cooperation between China and Kazakhstan a focus.
II. The problem of cultivated Land Resources in the countries along "Belt and Road"
In 1983, the World Food and Agriculture Organization noted that The goal of food security is "to ensure that all people can buy and afford at all times the basic food they need" (1999). Thus, the key to ensuring food security is to meet the food needs of a growing population. To improve the grain production capacity of cultivated land is an important task to ensure food security, and to improve the quantity and quality of cultivated land is the basic prerequisite to strengthen grain production capacity.
The world cultivated land area experienced three stages from 1961 to 1991, from rapid growth to slow growth and then to rapid growth. The overall growth trend was, however, 23 years from 1992 to the present. The world cultivated land area fluctuates between 1.3 billion and 1.4 billion hectares, showing no steady growth trend. The population has grown exponentially since 1961, rising to 8.309 billion by 2030 and rising to 9.15 billion by 2050, according to the Food and Agriculture Organization of the United Nations. As a result, the population has continued to grow since the end of the 20th century, and the cultivated land has generally remained unchanged. Contradictions are becoming increasingly apparent. Comparing the changes of cultivated land in the countries along "Belt and Road" during the stable fluctuation of world cultivated land since 1992, as shown in figure 6-9, it can be seen that the cultivated land of the countries along the "Belt and Road" route continues to decline by a relatively large margin. Compared to the world as a whole, the problem of arable land loss is even worse.
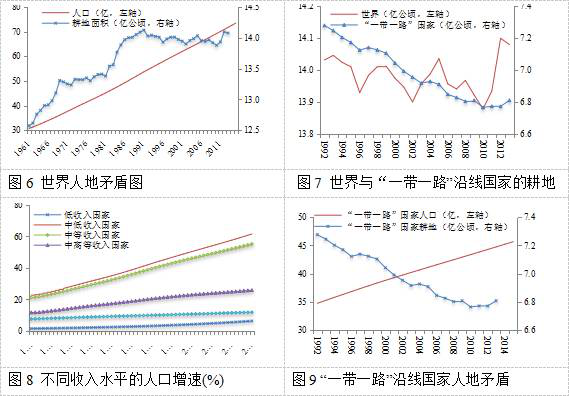
Fig. 6 world land contradiction map;Fig. 7 arable land in the world and countries along Belt and Road
Fig. 8 population growth at different income levels (%);Fig. 9 contradiction between people and land in countries along Belt and Road
Figures 6-9 show that human-land conflicts are more pressing in countries along Belt and Road. The population growth rate of different income countries is different. The population growth rate of low- and middle-income countries is higher than that of high-income countries and low-income countries. There are 45 countries along the "Belt and Road" line with middle income levels. 69.23%, "Belt and Road" along the country's population growth faster, coupled with the area of arable land in a downward trend, exacerbated the contradiction between man and land. Developing countries have a low level of productivity, a faster population growth and a decline in arable land. Such changes in cultivated land resources are severe in the world, in countries along the "Belt and Road" route are severer.
(2) . Countries along "Belt and Road" face urgent food security problems
Food demand increases with the increase in population, especially in the areas along Belt and Road, most of which are developing countries. Food is the basic need of the poor. Population growth leads to an increase in rigid demand. Increased demand due to the upgrading of the food structure and huge demand from the development of biomass energy. October 2011 Food and Agriculture Organization of the United Nations issued "World Food insecurity 2011: how international food price fluctuations affect countries Emphasizing the high and persistent volatility of food prices, Will further exacerbate food insecurity and seriously affect food security in food-importing countries The economic crisis in the corresponding countries was aggravated [4]. According to the joint prediction of the Organization for Economic Cooperation and Development of OECD and FAO, the pattern of grain trade has also been developed from the traditional natural resource endowment to the modern comprehensive endowment of natural resources, technical resources, capital resources, etc. Europe and the United States will further highlight the advantages of grain exports, "Belt and Road" involving developing countries will further increase the pressure on grain imports, grain trade will be more significant regional differences.
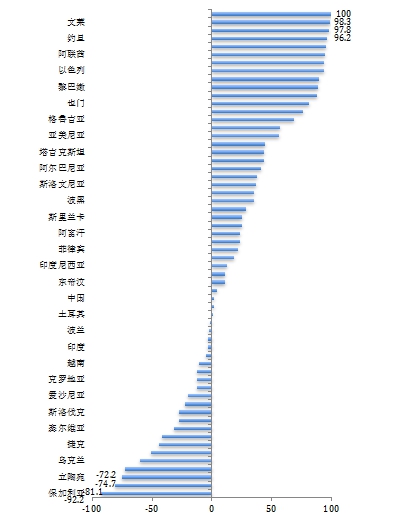
Fig. 10 dependence on grain imports of countries along "Belt and Road" (%)
Source: FAO Statistical Database
According to data provided by the Food and Agriculture Organization of the United Nations (FAO) on the food security indicator "Food import dependency" [5], Argentina was the least dependent on world food imports in 2009-2011, followed by Australia at -144.9, according to the Food and Agriculture Organization of the United Nations (FAO). Figure 10 shows the dependence on grain imports of countries along "Belt and Road", which is a positive indicator that the country's grain supply is mainly met by imports, and that the degree of dependence is negative, indicating that the country's grain exports are partly carried out in addition to being able to meet its own needs. Sixty-three percent of the countries along the "Belt and Road" route need to import to meet their food needs, including Marday. The dependence on grain imports in Bulgaria (-92.2%), Hungary (-81.1%) and Lithuania (-74.7%) is the lowest. China's dependence on grain imports is 2.1% and needs to be met through imports.

Fig. 11 level of cultivated land per capita and dependence on grain imports in countries along "Belt and Road"
(a) . Contains outliers (Kazakhstan);(b) Excluding outliers (Kazakhstan)
Source: world Bank WDI Database, FAO Statistical Database
Figure 11 shows the level of cultivated land per capita and dependence on grain imports in countries along "Belt and Road", in which the, (a) map contains outliers on the data (), (b) map of Kazakhstan excludes outliers (Kazakhstan). It can be seen that the lower the level of cultivated land per capita in the countries along "Belt and Road", the higher the degree of dependence on grain imports, and overall, there is a significant negative correlation between the two. The shortage of per capita cultivated land resources in the countries along "Belt and Road" makes them face more serious food security problems. It is of great significance to improve the level of per Capita cultivated land to ensure food security. Figure 11 (a) also shows Hasa The high cultivated land resources of Tajikistan are out of proportion to its grain export level. After removing Kazakhstan, scattered plot maps are made (such as figure 11, (b), fitting degree R2 increases from 0.399 to 0.536. Each increase of cultivated land resources by one unit will reduce the degree of dependence of cultivated land resources by more. The coefficient changed from -115.97 to -189.22. It can be seen that while increasing the per capita cultivated land resources in the countries along the route of "Belt and Road", the investment and development of agriculture in Kazakhstan is also an important task to ensure the food security of the countries along the "Belt and Road" line.
(3) . Industrialization and urbanization accelerate the Non-agricultural conversion of cultivated Land in the countries along "Belt and Road"
As a typical multifunctional natural resource, The loss of cultivated land resources in the process of industrialization and urbanization makes the life support system of the earth face a direct threat (Li Xiubin 1999). The reasons behind the sharp reduction of cultivated land area in the countries along "Belt and Road" from 1992 to now are worth exploring. The economic development inevitably has to go through industrialization and urbanization process. In the process of industrialization and urbanization, in order to meet the demand of construction land and industrial land, the trend of cultivated land non-agricultural is obvious, so the cultivated land resources have dynamic changes (Huang and Rozelle,1995). On the whole, the land becomes sandy and the population increases. The long process of urbanization and economic growth all have a certain impact on the change of cultivated land. This paper discusses the driving factors of the change of cultivated land in the countries along "Belt and Road". In order to protect the cultivated land resources of the countries along "Belt and Road" and solve the food security problems of the countries along the route, the countermeasures and suggestions are put forward, which is helpful to the promotion of the "Belt and Road" initiative.
The discussion on the driving factors of cultivated land change has mainly focused on the non-agricultural occupation of cultivated land in the process of industrialization and urbanization, including economic growth and population growth. The increase of urbanization level has an important influence on the change of cultivated land resources. Population growth has a dual impact on the change of cultivated land. On the one hand, population growth will increase the demand for agricultural products and increase the demand for cultivated land resources. On the other hand, population growth has increased the demand for residential, transportation and other land, which may lead to the conversion of part of cultivated land into residential, transportation and other non-agricultural land. International experience shows that densely populated In the process of industrialization, the country will inevitably suffer serious loss of cultivated land, the faster the industrialization process, the more the loss of cultivated land (Yu Zhenguo et al. 2003). Urbanization is an inevitable manifestation of regional economic and social development in space. Urbanization leads to non-agricultural occupation of cultivated land, which leads to a significant reduction in the amount of cultivated land (Li Xiubin 1996).
The study of cultivated land change in "Belt and Road" countries is mainly based on scattered national studies, focusing mainly on economic development, population growth and urbanization. From the perspective of economic growth (Tommy Firman,1997), population growth (Maxim and Naftaly,2002), urbanization (Adam and Krzysztof,2004), this paper discusses the causes of non-agricultural cultivated land. This part takes "Belt and Road" 65 countries as a sample to estimate the driving factors of cultivated land resource change by regression analysis on the influence of population, economy and urbanization on cultivated land. The overall cultivated land change mechanism of the countries along the way.
According to the existing theory, urbanization, economic development level and population growth have important influence on the change of cultivated land. In this part, 65 countries along "Belt and Road" from 1992 to 2013 are taken as samples, and the natural logarithm of cultivated land area is chosen as the explanatory variable. The main explanatory variables are population, urbanization level and economic level, in which population and economic level are expressed by natural logarithm of population scale and natural logarithm of per capita GDP, and urbanization is expressed by proportion of urban population to total population. The regression results obtained are shown in Table 1.
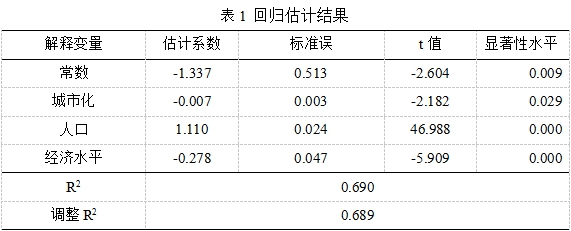
Table 1: Regression estimation results
From R2 value, we can see that the model fits well, and the coefficient is significant. Urbanization and economic level have a restraining effect on cultivated land change, while the population has a positive effect. The influence coefficient of urbanization on cultivated land change is -0.007, which means that the increase of urbanization level will reduce the cultivated land by 0.007. With the increase of per capita GDP, the cultivated land will be reduced by 0.278. The demand for cultivated land caused by economic development is smaller than that of non-agricultural land, especially in industries such as industry, real estate, transportation and so on. It can be seen that "Belt and Road" along the national economy The increase of economic growth and urbanization level leads to the increase of non-agricultural occupation of cultivated land, thus reducing cultivated land area. It can be seen that the increase of population by 1% will lead to the increase of cultivated land by 1.11%. The constant term includes some inestimable factors, such as the deterioration of ecological environment, soil erosion and other problems also cause the loss of cultivated land resources.
The current land use system can not fully express the non-agricultural value of cultivated land resources, driven by economic interests, cultivated land resources gradually turned into industrial land, construction land and other non-agricultural transition, which caused serious social problems. The threat to national food security is particularly acute in the case of relative scarcity of arable land in countries along Belt and Road (Song Min 2013). Yang Limin et al. (2013) mentioned that China's population will reach a peak of 1.437 billion in 2028. The demand for food for the overloaded population has exploded, making it face a more serious situation, while Cui Xufeng (2014) mentioned in his research. The urbanization rate has already exceeded 50%. China's urbanization is in a period of rapid development. This will inevitably lead to an increase in the demand for non-agricultural land. How to realize the common development of cultivated land resources security and urbanization has become an important issue that should be paid attention to by academic and practical circles.
Water resources of countries along "Belt and Road"
In the latter half of the 20th century, the water consumption of most countries increased sharply, and even water crisis occurred in some areas. This caused widespread concern in the world. The relevant organizations began to focus on water resources issues (Chen Jiaqi, 2003). The United Nations World Water Conference in 1977 has raised the issue of water resources to a global strategic height, with the growth of population. In 1998, a report by the World Commission on Environment and Development (WCED) pointed out that "water resources are replacing oil as a major global crisis problem" [6]. The World Economic Forum announced in January 2015 that the water crisis, the world's biggest risk, was based on quantifying the impact on society.
I. Basic characteristics of Water Resources in countries along "Belt and Road"
The water resources referred to in this paper mainly refer to the freshwater resources on land, and the indicators for the study of the use of water resources in "Belt and Road" countries are renewable inland freshwater resources. The data are mainly from the FAO Agriculture and Water Information system (AQUASTAT),). The renewable inland freshwater resources refer to the domestic renewable resources (inland rivers and surface water caused by rainfall). Calculated using the World Bank's population estimates (per capita renewable inland freshwater resources, hereinafter referred to as water resources).
(1) . Shortage of available water resources per capita in countries along the route of "Belt and Road"
The per capita water resources of the countries along Belt and Road are lower than the world average. According to the statistics of the United Nations Food and Agriculture Organization in 2014, there are 42.81 trillion cubic meters of renewable inland freshwater resources in the world, and 15.23 trillion cubic meters of renewable inland fresh water resources in countries along "Belt and Road". The proportion of the whole world is 35.58, while the population of the countries along "Belt and Road" accounts for 62.16% of the world's population, and 35.58% of the world's water resources provide for 62.16% of the population, especially in the countries along the "Belt and Road" route. The world's per capita water resources are 5930 cubic metres. In 2005, the average water resource per capita in the countries along Belt and Road was 3370 cubic meters, which was lower than the world average overall, while the water shortage in the Western Asia and North Africa region was particularly short.
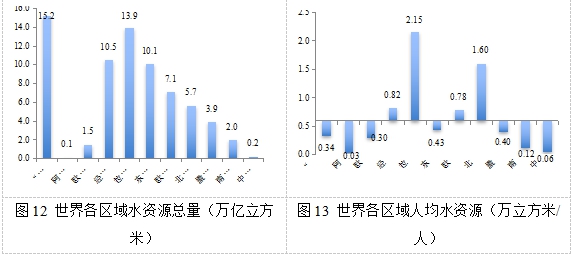
Fig. 12 total water resources in various regions of the world (trillions of cubic meters);
Figure 13 Water resources per capita in all regions of the world (10,000 cubic metres per person)
Source:World Bank WDI Database, 2014, Beijing normal University Research Institute of emerging Markets
Figure 13: the per capita water resources map of the world uses 5930 cubic meters of per capita water resources in the world as the intersection point of the horizontal axis. The upper side of the horizontal axis is higher than the per capita level of the world, and the lower side of the horizontal axis is lower than the per capita level of the world. It can be seen from figures 12 and 13 that the countries along the route of Belt and Road have the highest total water resources, but the per capita water resources are lower than those of the OECD, Latin America, Europe and Central Asia and North America, and there is a relative shortage of water resources in the world. Among them, the Arab League, South Asia, Middle East and North Africa have low water resources per capita, below the world per capita level.
Belt and Road, most of the countries in arid and semi-arid areas, is the world's most water-short region. Brazil has the world's highest water supply (5.661 trillion cubic meters) and Kuwait, the country with the most water shortages, is known as a country without water. The world's highest per capita freshwater resource is Iceland (519300 cubic meters per person), while the 10 countries with per capita water resources of less than 100 cubic meters are from "Belt and Road" countries, with Kuwait, Bahrain, the United Arab Emirates, Egypt, Qatar and other countries in the Arab world, Kuwait, Bahrain and so on have few recoverable fresh water resources. These areas In arid and semi-arid areas, the average precipitation depth is low in the world. Among the 67 countries whose average precipitation depth is less than 700 mm, 40 countries are along "Belt and Road", accounting for 60,000mm.
The United Nations defines water scarcity as extreme when per capita water resources in a region fall below 1700 cubic meters, when per capita water resources are below 1000 cubic meters, and when per capita water resources are below 500 cubic meters (Guo Jiuyi et al. 2016). Of the 50 countries with water shortages below 1000 cubic meters per person in the world, 24 are along Belt and Road, accounting for 48 percent. Of the 29 countries with a per capita water resource of 500 cubic meters / person below the critical water shortage line, 17 are along "Belt and Road", accounting for 58.62 percent. The majority of the "Belt and Road" countries are in the world. In the ranks of the most water-deficient country. According to statistics, Cambodian residents live on an average of only 6 litres of water a day. In 50 years' time, Kuwait (47), Qatar (58), Saudi Arabia (76), Bahrain (96) and Oman (177) are projected to be the second, third, fifth, seventh and eleventh most water-scarce countries in the Middle East and Africa, respectively (Mojay 2013). These water-deficient countries all come from "Belt and Road" along the country, therefore, the country's water resources are facing a huge crisis.
(2) . The contradiction of water use in the countries along the route of "Belt and Road" is prominent, and agricultural water uses too much resources.
The utilization ratio of water resources refers to the development and utilization of water resources in a certain area, which is generally expressed by the ratio of the amount used to the water resources. The higher the utilization rate of water resources is, the less water resources are available in the region and the supply cannot meet the demand. The practical experience of various countries all over the world shows that when the utilization ratio of surface water resources in a watershed exceeds 40, a series of problems such as serious shortage of water resources and deterioration of ecological environment will occur (Guo Daben 2007). This paper uses the annual total freshwater extraction as a percentage of internal resources (total inland freshwater resources) published by the FAO Agriculture and Water Information system as water resources The measuring index of utilization ratio. Annual fresh water extraction refers to the total source of water extraction, excluding the evaporation loss of the reservoir. In countries where desalination plants are an important source of water, the amount of water extracted from the desalination plant also includes water from the desalination plant. Where the extraction from non-renewable aquifers or salt water desalination plants is considerable, or where the recovery efficiency of wastewater is high, the extraction may exceed 100 per cent of the total renewable resources. Industrial and agricultural extraction is the total amount used for irrigation and livestock production as well as for direct industrial use (including the extraction of cooling water from thermal power plants). Civilian discharges include drinking water, municipal water or water supply, and public services, Businesses and residents use water.
The demand for water resources is greater than the supply in the countries along the "one belt and one road". The proportion of agricultural water in the use of water resources is the highest, exceeding the world average level. In.2014, the world uses 3 trillion and 986 billion cubic meters of water, and the water used by the countries along the belt and road is 2 trillion and 614 billion cubic meters, accounting for 65.58% of the world's total water consumption, accounting for 2/3 of the total world. The total volume of water resources is 4 billion 281 million cubic meters. The total water resources of the countries along the belt and road are 1 billion 523 million cubic meters, accounting for 35.58% of the world's water resources and over 1/3. At the same time, the demand for water reaches three of the world's total demand. Second, the shortage of water supply is even more urgent.
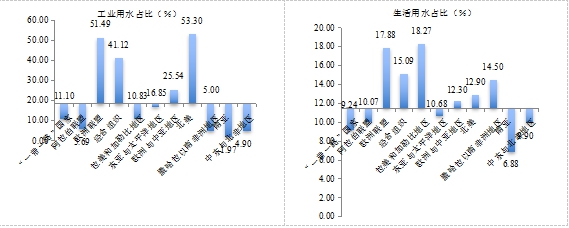
Figure 14 Water use efficiency and proportion of water for different uses in all regions of the world (2014)
Source: world Bank WDI Database, 2014, Beijing normal University Research Institute of emerging Markets
The utilization rate of water resources in the world is 9.32, of which the proportion of water used for agriculture is 69.86, the proportion of water for domestic use is 11.49, and the proportion for industrial water is 18.62. The world average is used as the cross point of the horizontal axis of each figure in fig. 14. Those above the horizontal axis are above the world average and those below the horizontal axis are below the world average. The utilization rate of water resources in the countries along "Belt and Road" exceeded the world average by 17.16.
Of the 36 countries whose utilization ratio of water resources in the world exceeds 40 percent, 23 are along "Belt and Road", accounting for 64 percent. Among them, the utilization rate of water resources in the Arab League is as high as 225.73.The highest utilization rate of water resources in the world is Bahrain, which has reached 893535 and Egypt. The United Arab Emirates, Turkmenistan, Saudi Arabia and other countries followed, with 43333, 2665, 1989, 1989 and 986, respectively. The Middle East and North Africa (138.4 percent) and South Asia (51.63 percent) are also well above the world average. And the proportion of water used in agriculture In terms of "Belt and Road" along the country far more than the world average, to 79.63. Among them, the Arab League (84.25%), South Asia (91.15%), Central Asia and North Africa (85.21%) exceeded the world average, and the regions with the most water shortage also accounted for the highest proportion of agricultural water, which were extremely short of water resources. Too high water use in agriculture hinders the use of industrial water in the process of industrialization and the use of domestic water in the process of population growth, resulting in the contradiction of water shortage. Increasing agricultural irrigation in countries along "Belt and Road" will help meet the food needs of population growth, but agricultural irrigation Use "Belt and Road" along the country 80% of fresh water resources, agricultural water use of excessive water resources.
With the development of human society and the rapid increase of population, the water consumption of industrial and agricultural production and people's living in the world is also increasing. Seventy percent of Belt and Road's 65 countries are middle-income countries. These countries are in the process of industrialization and urbanization, and the demand for industrial water is increasing dramatically. The increase of population and the improvement of living standard also increase the demand for domestic water, and the shortage of water resources in the countries along Belt and Road is more than that of the world average level, so the contradiction of water use will become more prominent.
II. Problems of Water Resources in the countries along "Belt and Road"
(1) . The low water productivity and low efficiency of irrigation water in the countries along the route of "Belt and Road" are the inducements.
Water productivity is an important index to reflect economic development and water resources consumption. Water productivity is calculated by using constant price GDP divided by annual total water extraction amount, which is expressed as 2010 constant value dollar GDP. per cubic meter of water.
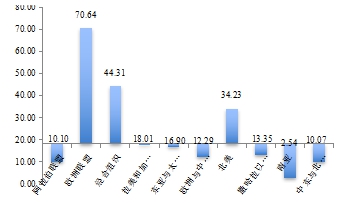
Fig. 15 Water productivity by region of the world (US $/ m3)
Source: world Bank WDI Database, 2014
The world average water productivity is US $18.22 / m3, which means that the GDP for every cubic metre of water used is US $18.22, which is the cross point of the horizontal axis in figure 15. We can see the Arab League of "Belt and Road", South Asia, Water productivity in the Middle East and North Africa is below the world average, especially in South Asia, where water productivity is just $2.54 per cubic meter. The European Union has the highest water productivity of $70.64 per cubic metre, followed by OECD ($44.31 / m3) and North America ($34.23 / m3), where water resources are utilized Only 16.45% 10.13% and 9.25%. Tajikistan, Kyrgyzstan, Uzbekistan, Turkmenistan in Central Asia, and Afghanistan, Pakistan, East Timor, Vietnam, Myanmar in the Middle East region, Nepal, in South Asia, has the lowest water productivity and one of the lowest productivity countries in the world, with productivity of less than $2. Even using 1 cubic meter of water to generate less than $2 of GDP, including China, is below the world average in 34 countries along Belt and Road.
The low productivity of water resources in the countries along Belt and Road may be caused by the waste of agricultural water. In Fig. 15, the League of Arab States with the lowest water productivity, South Asia, the Middle East and North Africa, is also the region with the highest agricultural water use in the world, reaching 84.25% 91.15% and 85.21% respectively. The data also showed that South Asia, the region with the highest agricultural land, had the lowest water productivity of $2.54, followed by the Middle East and North Africa at $10.07, and the Arab League at $10.10. On the basis of this assumption, this paper is concerned with the water in 65 countries of Belt and Road in 2014. The correlation analysis between productivity and the proportion of agricultural, industrial and domestic water use (see table 2) shows that agricultural water use and water productivity are negatively correlated in the countries along "Belt and Road". The correlation coefficient was -0.322, and the correlation coefficient between industrial water use and water productivity was 0.413, while there was a significant negative correlation between agricultural water use, industrial water use and domestic water use. The correlation coefficient between agricultural water and industrial water is -0.809, which shows that the proportion of agricultural water is seriously squeezed out of industrial water, which is the demand for industrial water in the industrialized process of the countries along the route of "Belt and Road", which is short of water. A crisis is also not conducive to the improvement of water production rate.

Table 2: Correlation analysis results
Source: World Bank WDI database
The latest World Water Resources Development report released by the United Nations in 2012 points out that water resources are seriously wasted in the world, with about 30 percent of water resources wasted every year in many countries due to poor management, old pipelines and leakage of ditches (Wang Chunxiao 2014). Belt and Road has failed to meet the demand for irrigation in most countries, a problem exacerbated by rapid population growth and inefficient use of water. Agricultural water consumption in the countries along the "Belt and Road" route accounts for 80 percent of the water resources, while the "Belt and Road" countries are seriously wasting agricultural water, allowing water to flow homeward into the gravity flooding method of the lower farmland below. Still is current "Belt and Road" along the country most farmer uses the universal practice. As a result of the introduction of traditional flood flooding over the years, most irrigation systems currently consume far more water than is needed. As a result of evaporation and leakage, agricultural irrigation water is usually lost by half, resulting in salinization and flooding of land and degradation of soil quality. Production has fallen, even without income.
Take China, the main country of "Belt and Road," and countries in Central Asia as sample. The main methods used in agricultural irrigation in China at present are the traditional way of "carrying water through soil canals and flooding with water," which causes water resources to leak and evaporate. A very low utilization coefficient of 65% of agricultural irrigation water is wasted (Jing Yuejun et al. 2000). The effective use of water for agriculture in China is only 40%, below the level of 70% to 90% in developed countries. China consumes 1300 catties of water to produce a kilogram of grain, while in developed countries it needs less than 1000 kg of water to produce a kilogram of grain ( Zhang Yongjun 2014. There are many transboundary rivers in the five countries of Central Asia, and the exploitation and utilization of water resources are also very complicated. The ecological problems caused by the large-scale and disorderly development and utilization of water and soil resources are quite prominent, and the water resources in Central Asia have been in a state of extensive predatory exploitation for a long time. A waste of water, which is a bigger water crisis for central Asian countries that are already short of water.
(2) . The world's conflicts caused by water resources mainly occurred in "Belt and Road" countries.
Regional conflicts occur frequently in "Belt and Road" because of water shortage. In 1991, the 7th World Water Resources Conference proposed that fighting for the right to use water resources in arid and semi-arid areas lacking water resources may lead to war (Biswas,1991). The United Nations Educational, Scientific and Cultural Organization (UNESCO) has found that 261 river valleys in the world are common to many countries and are sensitive areas that could trigger a water crisis. In the past 50 years, according to scholars, 1831 conflicts have been caused by water problems, 37 of which have risen to violence in 507 cases. Of the 21 military conflicts, 18 were between Israel and its neighbors along Belt and Road (Guo Daben 2007).
The Jordan River has a very important strategic role for Jordan, Israel and Palestine, the countries along the "Belt and Road" route. These countries are also in constant conflict over the competition for water resources. The Arab League countries built dams in the Jordan River tributaries to control the flow of water, but were destroyed by Israeli force and carried out air strikes against Syria, triggering the third Middle East War. As a result of this war, Israel encroached on and took away a great deal of water. Lebanon's recent construction of water pipelines in the Jordan River has come under Israeli threat of force. At present, 70% of Israel's water supply comes mainly from the 1948 border. Beyond the border, Palestine-Israel peace talks with land for water may be the important principle of peace talks. The Euphrates and Tigris rivers originate in Turkey, and plans by Turkey to build water in the Euphrates River through Syria and Iraq could deprive Syria of 40 percent of its water supply. Iraq almost lost 80-90, 85% of the Iraqi population water mainly from these two rivers. The three countries have great contradictions in sharing the water rights of the two rivers. On the one hand, Syria supports the Kurdish separatist movement in Turkey, while Turkey threatens to cut the Euphrates River, while using water resources in exchange for Iraqi oil The Indus River Pakistan jointly owns the Indus River Basin, but the upstream Indus River threatened Pakistan with a water cut, and the two countries signed a treaty on Indian rivers under the mediation of the World Bank. On the Ganges River, India's dam construction on the Ganges River has seriously affected southwestern Bangladesh, causing many disputes. After that, in 1997, Bangladesh and India signed the "Ganges River Water sharing Treaty" to ensure Bangladesh's water demand during the dry season. However, it has not been implemented. Water has become the only resource for the country to resort to force when it is in short supply (Yang Zhongqiang 2001).
Fossil Energy of countries along "Belt and Road"
According to the US Department of Energy Energy Information Administration (EIA) forecast, by 2030, fossil fuels will still account for 83% of the world's primary energy composition (Wang Keqiang, et al., 2009). Fossil energy, which is dominated by coal, oil and natural gas, has rich reserves and mature development technologies. Will continue to be before the middle of the 21 st century energy production and consumption of the main body. In this part, it is of great significance to study the characteristics and problems of fossil energy in the countries along "Belt and Road" for promoting energy cooperation under the framework of "Belt and Road".
I. Fossil Energy characteristics of countries along Belt and Road
Fossil energy is a hydrocarbon or its derivative. It is derived from fossil deposits of ancient organisms and is a primary energy source. When fossil fuels are not completely burned, they emit poisonous gases, but they are essential fuels for human beings. The data related to fossil energy used in this paper are mainly from the BP Energy Statistics Yearbook of the past years and the public data reported by the World Bank.
(1) . Countries along "Belt and Road" are the focus of fossil Energy production in the World
The countries along the route of "Belt and Road" are very important in the global energy market. This is the world's largest center of energy production. In 2015, the world produced 11.39 billion tons of oil equivalent from fossil energy and 6.927 billion tons of oil equivalent from countries along the road of "Belt and Road." The Asia-Pacific region accounted for 31.62 percent, North America 20.23 percent, and South America and Africa the lowest production of 5.42 percent and 6.5 percent.
Of the 65 countries along the "Belt and Road" route, (OPEC), the oil exporter, is concentrated in the Middle East region of "Belt and Road". Russia, Azerbaijan, Kazakhstan and Turkmenistan are also oil and gas exporters. China is the fourth largest oil producer. China and India are the first and third coal producers. Russia, Iran and Qatar are second, third and fourth gas producers. China, India and Russia ranked first, third and fourth in power production. In 2015, countries along "Belt and Road" provided the world with 57% of oil production, 53% of natural gas production and 70% of natural gas production. Coal production and 47 percent of electricity production.
In terms of oil production, the Middle East and Egypt contributed 33 percent of the world's oil production, Russia, Azerbaijan and Central Asian countries contributed 15.6m, and East and Southeast Asian countries contributed 7.4 percent. Saudi Arabia, in particular, produced 568.5 million tons of oil in 2015, contributing 13 percent to the world, ranking first and higher than the United States. Russia produced 540.7 million tons in 2015, contributing 12.4 tons, ranking third. In 2015, the world produced 3.2 billion tons of oil equivalent natural gas, and the countries along "Belt and Road" contributed 53 percent of the world's 1.695 billion tons of oil equivalent production. In 2000, North America contributed 28. 1% and Europe 27. 8%. Compared with oil production, natural gas in the "Belt and Road" more diversified. The Middle East contributes 17.4 percent of the world's natural gas, Russia 16.1. China, Southeast Asia and India together contribute 12.2 percent. Azerbaijan and Central Asian countries are also important producers. Most of the world's coal production takes place in countries along Belt and Road, especially China, which accounted for 47.7 percent of the world in 2015. In addition to China, India accounts for 7.3 percent of the world, while Indonesia accounts for 6.3 percent. Russia has a large share of 4.8 percent. Belt and Road has contributed 70 percent of the world's coal production and is undoubtedly the center of coal production.
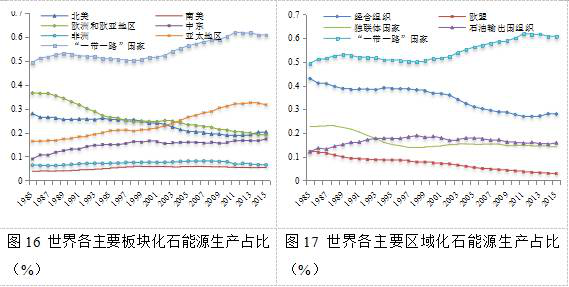
Fig.16: Proportion of fossil energy production in major plates of the world (%);
Fig.17: Proportion of fossil energy production in major regions of the world (%)
Source: BP Yearbook of World Energy Statistics, 2015, Beijing normal University, Emerging Markets Institute
Figures 16 and 17 show the dynamic changes in the Proportion of fossil energy production in major regions and organizations of the world, and the dynamic changes in the proportion of fossil energy production in the major regions of the world between 1985 and 2015. From 49.33 percent of the world's total in 1985 to 60.81 percent in 2015, the countries along the "Belt and Road" route have long been on top of other regions of the world. The proportion of fossil energy production in Europe and North America has declined, while that in the Asia-Pacific region has been on the rise. This is due to its advantages in coal production, while the Middle East oil and gas supplies have risen. OECD and EU fossils The proportion of energy production in the world is decreasing year by year. Countries along Belt and Road have long been at the centre of global fossil energy production and will continue to grow.
(2) . World Energy consumption Center is moving rapidly to countries along "Belt and Road"
In Energy Outlook 2030, published in December 2012, BP of the UK predicts that primary energy consumption in developing countries will account for 933 percent of global consumption by 2030, especially in China. Representative emerging developing countries such as India will make a huge contribution to global energy consumption (Peng Qian et al. 2014).
In 2015, the total consumption of fossil energy in the world was 11.306 billion tons of oil equivalent, of which 5.93 billion tons of oil equivalent was consumed by countries along "Belt and Road", accounting for 52.45 tons of oil equivalent in the world, contributing more than half of the consumption of fossil energy. The countries along Belt and Road consume 39.9 percent of petroleum and 72.2 percent of natural gas and 43.61 percent of fossil energy consumption in the Asia-Pacific region. However, the consumption of fossil energy in the Middle East, Africa and South America is only 7.76% of that in the world, 3.55% and 4.57%, while the consumption of fossil energy in the world is relatively low. China, India and Russia ranked second and fifth in world oil consumption. Russia and China rank second and third in natural gas consumption. China ranks first in coal consumption with 50% of the world's coal consumption, while India ranks second with 10.6%. These two countries account for more than 60 percent of global coal consumption.
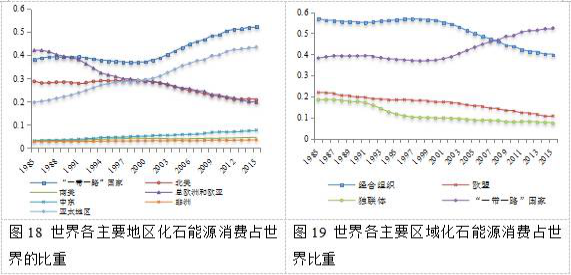
Fig.18: The Proportion of fossil energy consumption in the world in major regions of the world;
Fig. 19: The Proportion of fossil energy consumption in the world in major regions of the world
Source: BP Yearbook of World Energy Statistics, 2015, Emerging Markets Institute, Beijing Normal University
The world fossil energy consumption center of gravity is rapidly shifting to "Belt and Road" along the country. Judging from the dynamic changes in energy consumption in various regions since 1985 in figure 18, the countries along the "Belt and Road" route and the Asia-Pacific region are increasing year by year. Europe and North America have begun to decline from the relatively high consumption in 1985 to the Middle East. Fossil energy consumption in South America and Africa remains low, with world consumption shifting to countries along Belt and Road. Comparing the energy consumption of the major organizations in the world in figure 19, the OECD, the EU and the CIS countries all have a downward trend, especially from the OECD's 198. In five years, the proportion of consumption in the world dropped from 56.97 percent to 39.75 percent in 2015, while the energy consumption of "Belt and Road" countries rose all the way from 38.23 percent in 1985 to 52.45 percent in 2015. The European Union also showed a downward trend, from 21.94 percent to 10.833 percent.
In the post-industrialization period, the economy of developed countries developed to the industrial structure of low energy consumption and high output, the manufacturing industry with high energy consumption gradually turned to developing countries, and developed countries attached great importance to energy conservation and energy efficiency. The countries along Belt and Road and the Asia-Pacific region are entering the period of industrialization, and with the rapid population growth, the demand for fossil energy is growing rapidly. Oil consumption centers are shifting to oil-producing and developing countries, with faster growth and higher consumption. Population and economic growth make Belt and Road a growing area of energy demand in the future. "Belt and Road "The state is the center of production and consumption in the world. Whether it is production or consumption, it has the right to speak. Therefore, energy cooperation has great potential in the" one belt and one road "initiative.
(3) . Per capita fossil energy consumption remains low in most countries along "Belt and Road"
The countries along the route of "Belt and Road" are the world's center of fossil energy consumption, but the per capita energy consumption is not high. The world's per capita fossil energy consumption is 1.54 tons per person per year, and the number of countries along the "Belt and Road" route is 1.298 tons / person, which is lower than the world average. OECD per capita consumption of 3.503 tons per person, the European Union is 2.403 tons per person, higher than the world average. Visible "Belt and Road" along the country per capita consumption is very low. India is a typical example. India's total consumption is the third largest in the world, after china and the United states, but its per capita consumption is only 0.494 tons per person, and the number of people who have access to electricity at home The population accounts for only 78.7% of the total population, and 21.3% of the population can not meet the basic demand for electricity. The energy consumption of the vast number of developing countries is still to meet the basic needs of living.
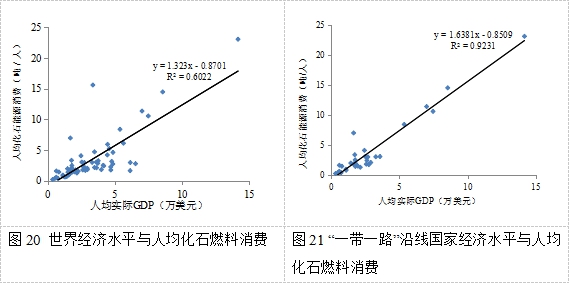
Fig. 20: World Economic level and per capita consumption of fossil fuels;
Fig. 21: Economic level and per capita consumption of fancy fuels in countries along Belt and Road
Source:BP World Yearbook on Energy Statistics, 2015
Worldwide, the higher the economic level, the higher the per capita fossil energy consumption, and the better the fitting level of the equation in figure 20, with the exception of Trinidad and Tobago, Switzerland, Ireland and Norway. This may be because these regions focus on environmental protection and on the development and utilization of new energy technologies, such as water, solar and wind energy, in order to avoid environmental pollution from fossil energy, and Switzerland in particular has made a great contribution in this regard, Its research solar car and solar-powered aircraft technology has been relatively mature. Fig. 21 using "Belt and Road" country as a sample, it is found that the fitting effect is better and R2 is 0.923, while the economy is better. The level of the impact coefficient on the consumption of fossil fuels reached 1.638, which shows that the higher the level of economic development in the countries along the belt and the higher the per capita consumption of fossil fuels, and the distribution of the major consumer countries in terms of coordinates shows that most countries concentrate on GDP below US $40 thousand per capita. The characteristics of average consumption level.
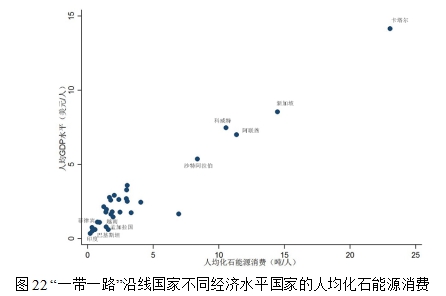
Fig.22:
Source: world Bank WDI Database, BP World Energy Statistics Yearbook, 2015.
According to the distribution of the countries in figure 22, Qatar, Kuwait, the United Arab Emirates and Saudi Arabia have sufficient oil and gas supplies, so per capita fossil energy consumption is relatively high, while Singapore has a developed economy, although it is not rich in energy resources. With enough money to support its energy imports, people have high access to fossil energy. The regions with the lowest per capita energy consumption are Bangladesh, the Philippines, Pakistan, India and Vietnam, which consume 0.189 tons per capita in Bangladesh, 122 times in Qatar and 32.26 times in the United States. These countries have lower rates of electricity, Bangladesh's 59.6 percent, India's 78.7 percent, and the world's affordable electricity rate of 84.58 percent, which are below the world average. Nearly half of Bangladesh's population has no access to electricity and basic needs are unmet.
(4) . The separation of production and consumption space of countries along the "Belt and Road" has promoted it to become the focus of world energy trade
There are spatial distribution differences between energy supply and demand in the countries along "Belt and Road", which makes the regional distribution of production and consumption appear serious dislocation, which urges the countries along the route of "Belt and Road" to become the center of world energy trade. The Middle East region is the largest oil exporter in the world, and the Asia-Pacific region is the largest oil import place. Therefore, there is a problem of separation between production and consumption in the countries along "Belt and Road". The difference between production and consumption in the countries along Belt and Road is also called the difference of production and consumption, which indicates the difference between supply and demand.

Fig. 23: The difference of fossil Energy production and consumption in the countries along Belt and Road (Million tons of oil equivalent)
Source: Source: BP World Energy Statistics Yearbook 2016, 2015
Figure 23 shows the difference between the production and consumption of fossil energy in the countries along "Belt and Road", which represents that the national fossil energy production is greater than the consumption, while the negative value indicates that the production is less than the consumption. It can be seen that the gap between supply and consumption of the countries along "Belt and Road" fluctuates from -492 million tons of oil equivalent to 657 million tons of oil equivalent, the space between production and consumption is separated, and the energy flows along the road to supplement the consumption gap. We can see that China is a big consumer country, India, Turkey and Singapore are all big consuming countries, while the big energy countries are Russia, Saudi Arabia, Iraq and other countries, producing energy. In addition to being able to supply their own consumption, export is a major energy exporting country.
The separation of production and consumption between regions promotes the expansion of energy trade. Regional distribution shows that the Middle East is the most important exporter of countries along "Belt and Road", contributing more than 50 percent to China's oil imports and India's oil imports to more than 50 percent. Singapore's oil imports account for more than 80 per cent of its oil imports, an indication of the importance of the 21 st Century Maritime Silk Road. Russia and Central Asia are relatively weak relative to the importance of oil trade in the Middle East, a country along Belt and Road. In 2015, Russia contributed only to China's oil imports One in eight, other CIS countries export even less. Russia and other CIS countries export less to India and other Asian and African countries than China. In the region along Belt and Road, Russia, the Middle East and Indonesia are major exporters of natural gas, including pipeline gas and liquefied natural gas, while in terms of demand, China is the biggest buyer of natural gas, importing 27.6 billion cubic meters of pipeline natural gas and 26.2 billion cubic meters of liquefied natural gas in 2015. Visible, future in "Belt and Road" under the framework of energy trade cooperation has great potential.
(5) . The consumption structure of the countries along "Belt and Road" is dominated by coal consumption for a long time and has a growing tendency.
The energy consumption structure is influenced by the regional resource endowment and production structure. For example, the most abundant oil and gas resources in the Middle East make the energy consumption more inclined to oil and natural gas, while the coal resources are abundant in the Asia-Pacific region. In Europe, natural gas production is higher than oil, so natural gas consumption is the most in its energy consumption structure (Zhu Meng-chueh et al. 2008).
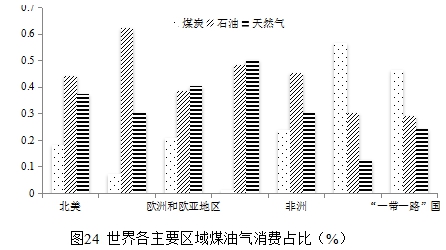
Fig.24: Proportion of coal, oil and gas consumption in all major regions of the world (%)
Source: BP World Energy Statistics Yearbook 2016, 2015, Beijing normal University Research Institute of emerging Markets
Figure 24 shows that overall, the Asia-Pacific region accounts for the highest proportion of coal consumption. This is because, on the one hand, China is a major coal producer in the world; on the other hand, these regions have a relatively low level of economic development, and the use of coal is relatively widespread. As a result, "Belt and Road" along the country as a whole coal consumption is also high. South America and North America had the highest oil consumption, while the Middle East had higher oil and gas consumption because of high resource endowments and lower costs of producing oil and gas. It can be seen that resource endowment determines the energy consumption structure of the region to a certain extent. Countries that are highly dependent on some kind of energy are mostly due to their natural resources, many of them Countries highly dependent on oil are themselves oil-rich countries, such as Kuwait and Saudi Arabia, while many countries that depend on natural gas are rich in natural gas, such as Turkmenistan, Qatar, Iran and the United Arab Emirates. China and India are very rich in coal resources. However, some highly dependent countries are still dependent on energy imports, such as Belarus, Bangladesh, the Philippines and Singapore.
From the perspective of consumption structure, North America and South America and other developed regions are mainly oil and gas consumption structure. The consumption structure of the countries along Belt and Road and the Asia-Pacific region is still dominated by coal consumption, with coal consumption accounting for 46.61 percent, oil 29.11 and natural gas 24.28. The world average consumption of coal is 33.96, oil is 38.31 and natural gas is 27.73. Belt and Road's Proportion of coal consumption exceeds the world average, while oil and gasProportion is below world level.
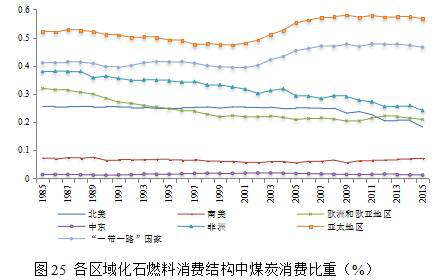
Fig.25: Proportion of coal consumption in fossil fuel consumption structure in various regions (%)
Source: BP World Energy Statistics Yearbook 2016, Beijing normal University Research Institute of emerging Markets
Figure 25 shows the change in the Proportion of coal consumption in major regions of the world, as Africa, Europe and North America began to see a gradual decline in the Proportion of coal consumption in 1985. The coal consumption ratio of the countries along "Belt and Road" is gradually rising. Almost half of the countries in the Asia-Pacific region are "Belt and Road" countries. According to the rising rate of coal consumption between them and the Asia-Pacific region, The rising coal consumption ratio in the Asia-Pacific region directly leads to an increase in coal consumption in countries along Belt and Road. South America and the Middle East have long maintained a low proportion of coal consumption. It can be seen that "Belt and Road" along the line is in the period of rapid industrialization development. In our country, the cost of carbon emissions has not yet had a significant impact on its fuel selection. The consumption structure of coal is not reasonable, which leads to high energy consumption, low energy efficiency, energy waste and serious pollution problems.
II. Problems arising from Energy consumption in countries along "Belt and Road"
(1) . The energy consumption structure based on coal makes the countries along "Belt and Road" facing greater pressure of carbon emission reduction.
Because greenhouse gases from energy consumption cause global warming, the World Energy Outlook (2008) forecasts that emissions of energy-related carbon dioxide will rise to 41 billion tons by 2030. The increase of 45% compared to 2006 may cause the global average temperature to rise by 6 ℃. And according to projections, 75% of the world's energy-related CO2 emissions could come from China, India, and the Middle East (Wang Keqiang and others). Fossil fuel-based energy consumption structure is becoming an important cause of global warming (Fan Shitao et al. 2013), "Belt and Road" along the road. More than two-thirds of the countries in the line are developing countries in the process of industrialization. As developing countries such as China, India and other developing countries enter an energy-intensive stage of development, the demand for energy in these countries has greatly increased. In addition, the energy structure of the countries along Belt and Road is dominated by coal consumption, and coal combustion produces higher carbon dioxide than other fuels, which makes it face more serious environmental problems.
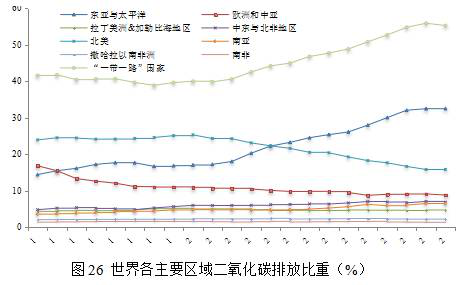
Fig.26: Proportion of carbon dioxide emissions in major regions of the world (%)
Source: world Bank WDI Database, Emerging Markets Institute, Beijing normal University
In 2013, 358.486 billion tons of carbon dioxide were emitted globally, and 197.974 billion tons of carbon dioxide were emitted by countries along the "Belt and Road" route, accounting for 55.23 tons, or more than half. Figure 26 shows the dynamic changes of carbon dioxide emissions in major regions of the world. It can be seen that the proportion of carbon dioxide emissions of countries along "Belt and Road" has been increasing year by year since 1992. From 41.55% in 1992 to 55.23% in 2013, especially after 2000, the Proportion of carbon dioxide emissions in the world has increased rapidly, which may be due to the rapid industrialization of developing countries. Cheng energy demand increased, while not pay attention to energy conservation and environmental protection, resulting in a large amount of carbon dioxide emissions. It can be seen that the proportion of carbon dioxide emissions in the world has decreased since 2000 in North America and Europe, while the Asia-Pacific region and countries along the "Belt and Road" increase in carbon dioxide emissions.
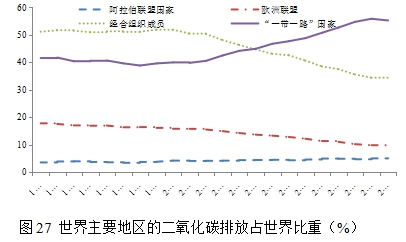
Fig.27: Carbon dioxide emissions from major regions of the world as a Proportion of the world (%)
Source: world Bank WDI Database, Emerging Markets Institute, Beijing Normal University
Figure 27 shows the dynamic changes in the proportion of carbon dioxide emissions in the OECD, the Arab League, the European Union, and "Belt and Road" in the world. It can be seen that the OECD exceeded other regions in carbon dioxide emissions in 1992. At 51.12, this period was a period of industrialization in most OECD countries, where the need for energy was high, and the focus on economic growth was greater than on energy conservation. Since 2000, the proportion has gradually dropped to 34.14% in 2013, and the opposite direction of this dynamic change is the "Belt and Road" along the country, in 1992 the proportion of carbon dioxide emissions was 4. 1.55, which grew rapidly in 2000 and reached 55.23 in 2013, which shows that the energy consumption structure has changed with the development of the economy. At the same time, the European Union and Arab League countries account for a lower Proportion of the world's total carbon dioxide emissions, with the EU focusing more on energy conservation and the Arab League with less energy consumption overall.

Fig.28: Proportion of carbon dioxide from kerosene fuel in major regions of the world
Source: World Bank WDI Database, Emerging Markets Institute, Beijing Normal University
From the point of view of energy consumption structure (Fig. 28), coal accounts for 42% of the world's carbon dioxide emissions, oil accounts for 33%, natural gas accounts for 18%, and coal accounts for 56.41% of the carbon dioxide emissions of the countries along the belt and road, far exceeding the world level. This is closely related to the consumption structure dominated by coal. From the regional comparison, it can be seen that the carbon dioxide produced in the Asia Pacific region is 68% of the total carbon dioxide generated by the combustion of coal in the region. It is expected that optimizing the energy consumption structure and reducing coal consumption will help to reduce carbon dioxide emissions.
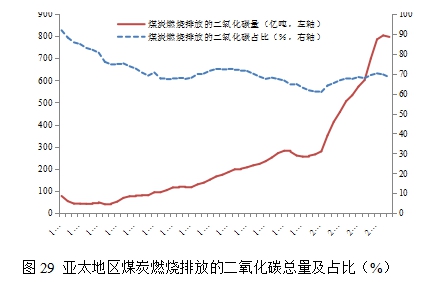
Fig. 29: Total and Proportion of carbon dioxide emitted from coal combustion in the Asia-Pacific region (%)
Source: World Bank WDI Database, Emerging Markets Institute, Beijing Normal University
Most of the major coal consuming countries of "Belt and Road" come from the Asia-Pacific region, and the carbon dioxide emissions from coal consumption and production are also directly related to the carbon dioxide in the Asia-Pacific region. Figure 29 shows the total amount and proportion of carbon dioxide emitted from coal combustion in the Asia-Pacific region. It can be seen that from 1960 to 2000, the total amount of carbon dioxide emissions continued to rise, but not by a large margin, but after 2000 there was an extremely rapid increase. In terms of the proportion of carbon dioxide emitted from coal to total energy emissions, it declined rapidly from 1960 to 1974, then remained relatively stable and declined slightly in 1975, and by the year 2000 In the future, the proportion will rise again. This may be related to the rapid industrialization and urbanization of most countries in the Asia-Pacific region after entering the 21st century, and economic development has increased the demand for coal fuel. At the same time, the urgent economic growth needs of developing countries make them overuse coal energy to ignore the environmental problems caused by carbon emissions, and lack of practical and effective measures to reduce carbon emissions.
(2) . The countries along "Belt and Road" have low energy use efficiency and great potential for energy saving and consumption reduction.
Energy intensity is an index to evaluate energy economic efficiency, which refers to energy consumption per unit GDP. The higher the energy intensity of GDP, per ton of standard oil / 10, 000 US dollars, the more energy consumption per unit GDP, the lower the energy efficiency. The world energy intensity is 1.306. More than a third of the countries along "Belt and Road" have energy intensity higher than the world average, including Turkmenistan's energy intensity of 3.697, Ukraine, Uzbekistan, Bahrain, Kyrgyzstan, Kazakhstan and Russia have more than 2 energy intensity. These countries are also the most energy-rich countries, while the developed countries are Germany. Japan was only 0. 913, Japan was 1. 004, and France was 1. 03. In the major regions of the world, the EU is 0.932 and the OECD is 1.141, which is below the world average, is more energy efficient and consumes less energy per unit of GDP.
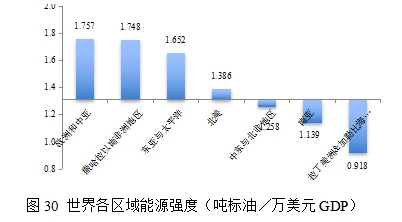
Fig. 30: Energy intensity in all regions of the world (tonnes of standard oil / US $10,000 GDP)
Source: world Bank WDI database
Figure 30 shows a comparison of energy intensity in all regions of the world, with the world energy intensity average level 1.306 as the crossroads, and the regions above the horizontal axis with energy intensity higher than the world average. Areas below the horizontal axis are below the world average for energy intensity. The picture shows that the world as a whole is still in a situation of high energy intensity, especially in South Africa, where the energy intensity is 2.132, that is, 2.132 tons of oil is needed to produce GDP, and the efficiency of energy use is very low. The energy intensity in the Asia-Pacific region is also higher, at 1.652, higher than the world average. And Latin America. The region's energy intensity is very low, Latin America is 0.918, energy efficiency is high.
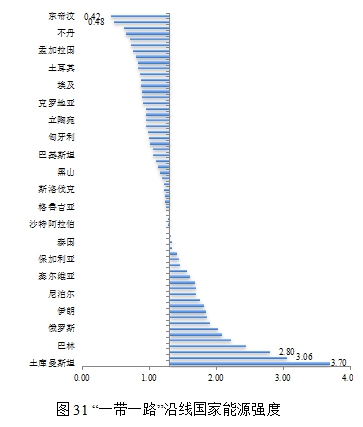
Fig.31: Energy intensity of countries along Belt and Road
Source: world Bank WDI database
Figure 31 takes the world average level of 1.306 as the intersection of the vertical axis and the horizontal axis, so that the countries on the left side of the axis are below the world level, and those on the right side of the axis are countries above the world level. We can see that there is a very large difference in the energy intensity within the countries along the "Belt and Road" route. The areas with the highest energy intensity are 8.8 times as high as those with low energy sources. Turkmenistan, the Central Asian country along the way, which is higher than the world energy level, is located in Central Asia. Uzbekistan, Kyrgyzstan, where energy intensity is very high and above world level, is basically an energy-rich region, including the Arab League countries. China, Russia, etc., this may be because of the energy rich in the use of resources to pay less attention to energy efficiency issues.
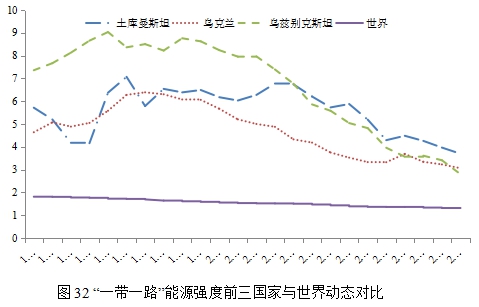
Fig.32: Belt and Road energy intensity of the top three countries and the world dynamic comparison
Source: world Bank WDI database
Figure 32 shows that the three countries with the highest energy intensity along "Belt and Road" are Turkmenistan, Ukraine and Uzbekistan, which have long been above the world average in terms of energy intensity and low efficiency in energy use. This may be related to the natural resources of these countries, rich in energy, Turkmenistan is rich in oil and gas, gas reserves ranked fifth in the world. Ukraine and Uzbekistan are rich in mineral resources. But judging from the dynamic changes of energy intensity in these three countries from 1990 to now, there is a downward trend in the three countries as a whole, including Uzbekistan's energy intensity. In 1990 it was 7.36. After 23 years of development, it fell to 2.8 in 2013, and energy intensity declined more, while the other two countries experienced little decline after volatility.
Improving energy efficiency is a key concern for national policy makers, but the full potential of energy efficiency has not yet been realized. In 2011, China announced its goal of reducing energy intensity to 16 by 2015, but there is still great potential for energy efficiency improvement. The energy efficiency potential in the construction sector is almost 80%, while in the industrial sector it is more than 50% (IEA / 2012). With the progress of energy technology in the world, the energy consumption is gradually decreasing. It is predicted that the potential of energy consumption reduction in developing countries, including China and India, is the greatest, almost 2.3-3 in developed countries. 2.2-fold (Wang Keqiang et al. 2009).
Reference
[1] Adam Wasilewski, Krzysztof Krukowski. Land conversion for suburban housing: a study of urbanization around Warsaw and Olsztyn, Poland. Environmental Management, 2004,34(2): 291-303.
[2] Biswas A K.Water for Sustainable Development in the 21st century[J] .Water International, 1991, 16(4):219-224.
[3] Chris Sanders. “What’s Next for Ukraine?”in Asset recovery, civil society, Europe and Central Asia, 16 December 2016.
[4] Daniel Kaufmann,Aart Kraay and Massimo Mastruzzi. Governance Matters VIII: Aggregate and Individual Governance Indicators 1996-2008. The World Bank,Development Research Group Macroeconomics and Growth Team,June 2009.pp6.
[5] Daniel Kaufmann,Aart Kraay and Massimo Mastruzzi. The Worldwide Governance Indicators: Methodology and Analytical Issues. World Bank Policy Research Working Paper No. 5430.Sept.2010.pp4.
[6] Francis Fukuyama. What is Governance?Governance: An International Journal of Policy,Administration,and Institutions, 2013, 26(3): 347-368; alesina a. enrico spolaore. the size of nations. Cambridge: the mit press,1997.
[7] Hatna E, Bakker M M. Abandonment and expansion of arable land in Europe. Ecosystems, 2011, 14(5): 720-731;
[8] Huang, J., S. Rozelle. Environmental stress and grain yields in China, American Journal of Agricultural Economics ,1995(4):853-864.
[9] Li X, Yeh A G O. Modelling sustainable urban development by the integration of constrained cellular automata and GIS. International Journal of Geographical Information Science, 2000, 14(2): 131-152;
[10] Maxim Shoshany, Naftaly Goldshleger. Land - use and population density changes in Israel—1950 to 1990:analysis of regional and local trends. Land Use Policy,2002,19:123-133.
[11] Sean L. Yom and F. Gregory Gause Ⅲ, Resilient Royals:How Arab Monarchies Hang on,Journal of Democracy,Vol.23,No.4, October 2012,p.80.
[12] Tommy Firman. Land conversion and urban development in the Northern Region of West Java, Indonesia. Urban Studies,1997,34(7):1027-1046.
[13] Wang J, Chen Y Q, Shao X M. Land-use changes and policy dimension driving forces in China: Present, trend and future. Land Use Policy, 2012, 29: 737-749.
[14] Zhao Minyan, Dong Suocheng, Assessment of Countries’ Security Situation along the Belt and Road and Countermeasures. Bulletin of Chinese Academy of Sciences, 2016,31(6):689-696.
[15] Zhen L, Cao S, Cheng S, Xie G., Wei Y, Liu X, Li F. Arable land requirements based on food consumption patterns: case study in rural Guyuan District, Western China. Ecological Economics, 2010, 69(7):1443-1453;
[16] Zeng, X. H,Yang, S. "Color Revolution" from the Perspective of Social Movement Theory [J]. Russian, Central Asian & East European Studies,2006(2):57-65.
[17] Chen. J. Q, Wang. H, Yang, X. L. Science of water resources[ M] . Beijing:
Science Press, 2003.
[18] Cui, X. F. Population urbanization and Land urbanization in ethnic areas: disequilibrium and Spatial heterogeneity. China Population Resources and Environment, 2014, 24(8): 63-72.
[19] Dong, Z. Q,Wei, X.H,Tang, C. Q. Institutional soft environment and economic development [J]. Management World,2012(4):9-12.
[20] Fan, S.T., Zhao, Z., Zhou, J.C. Theme - World Energy patterns: four Trends[J]. Review of Economic Research,2013,02:17-42.
[21] Guo, D.B. The present situation and harm of water shortage of resources in the world[J]. Journal of Engineering of Heilongjiang, 2007,04:105-110.
[22] Guo, J.Y., Yu, B. World water shortage: save water and desalination[J]. World Environment, 2016,02:58-61.
[23] International Energy Agency. A New Global Energy Map and Development Trends-World Energy Outlook 2012[J]. International Petroleum Economics, 2012,12:1-6.
[24] He, G.C. An Analysis of the relationship between political system and Economic Development: a New Perspective of Comparative Politics[J]. Management World,2005(4):155-166.
[25] Jing, Y.J., Wang, S.J. The problems and Countermeasures of China's Freshwater Resources in the Future Development[J]. Population Journal, 2000,04:3-7.
[26] Li, X.B., The International Research trend of Land use and Land cover change - the Core Field of Global Environmental change Research. Acta Geographica Sinica, 1996, 51(6).
[27] Li, X.B., Change of Cultivated Land Area in China in the past 20 years and its Policy Enlightenment. Journal of Natural Resources, 1999, 14(4): 329-333.
[28] Liao, H., Wei, Y.M. Research on the difference and imbalance of World Energy consumption and its change[J]. China Soft Science, 2010,10:6-14.
[29] Max Weber,Translated by Lin Rongyuan., Wirtschaft und Gesellschaft[M]. Beijing:The Commercial Press,1997:241.
[30] Mo, J. Human Water crisis in the 21st Century[J]. Science, 2013,05:44-47+4.553-557.
[31] Pan, Z.X., Chen, X.H., Liu, D.D., Index system and method of regional water crisis evaluation[J]. Journal of Irrigation and Drainage, 2008, 27(4): 85-88.
[32] Peng, Q., Yao, L, Hu, G. S., China's Energy Security and Countermeasures[J]. Finance & Economics, 2014,10:73-80.
[33] Samuel P. Huntington. Political order in changing Society[M]. Shanghai:Shanghai Century Publishing Group, 2008(7):31-32.
[34] Shi, P.J., Yang, M.C., Chen, S.M., Research on the level and Security of Grain Self-sufficiency rate in China[J] . JOURNAL OF BEIJING NORMAL UNIVERSITY (SOCIAL SCIENCES), 1999(6):74 -80.
[35] Song, M., Analysis and Evaluation of Environmental cost in the Utilization of cultivated Land Resources A case study of Wuhan City, Hubei Province[J]. Chinese Journal of Population Resources and Environment, 2013, 23(12): 76-83;
[36] Wang, C.X. Global Water crisis and Ecological Utilization of Water Resources[J]. Ecological Economy, 2014,03:4-7.
[37] Wang,K.Q., Zuo, N., Liu, H M., Analysis on the trend of International Energy Development[J]. Journal of Shanghai University of Finance and Economics,2009,06:57-64.
[38] Xiao, H.Y.,Gong,T., Some theoretical problems in the study of Corruption[J]. Comparative Economic & Social Systems ,2016(2):48-60.
[39] Yang, L. M., Yu, M.. Analysis on the demand of cultivated Land for Future population Development in China[J]. Economic Geography, 2013, 33(2): 168-171.
[40] Yang, S.,Zeng,X.H.,The political and Cultural causes of Institutional changes in Central Asian countries[J]. Russian East European & Central Asian and Studies,2007(6):16-25.
[41] Yang, Z.Q. Water resources and the Middle East peace process[J]. Arab World Studies, 2001, (3):26-29.
[42] Yu, R.N., Yu, X. F.. Fresh water resource competition[J]. Jilin Water Resources, 2006, 04:51-54.
[43] Yu, Z.G., Hu, X.P., Research on the relationship between Grain Security and the quantity and quality of cultivated Land in China [J]. Geography and Geo-information Science, No. 3 2003
[44] Zhang, Y. J. A worrying water crisis[J]. The development of the western region in China, 2014,Z1:146-147.
[46] Zhu, M.Y., Chen, Z.N., Cai, G.T., Analysis of World Energy Spatial pattern based on system Theory [J]. Progress in Geography, 2008,05:112-120.
[47] 《Security Risk Assessment About Countries Along B&R》 Editorial committee. Security Risk Assessment About Countries Along B&R [M]. China Development Press,2015(12).
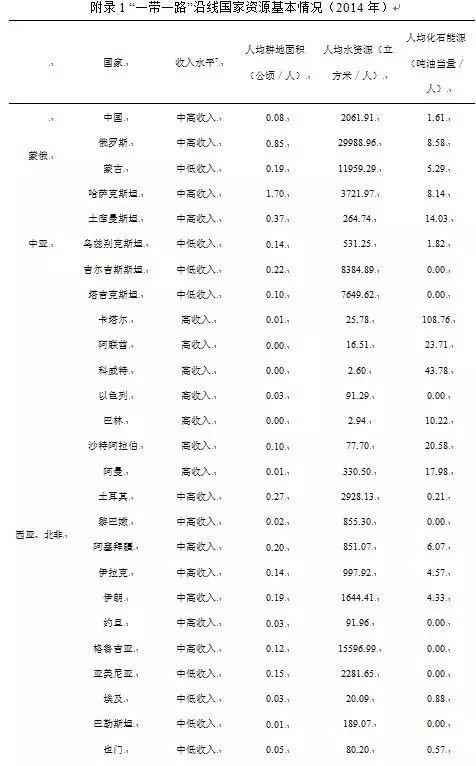

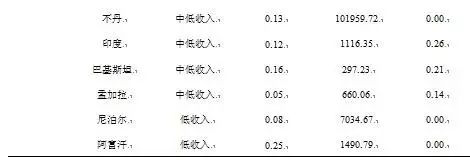
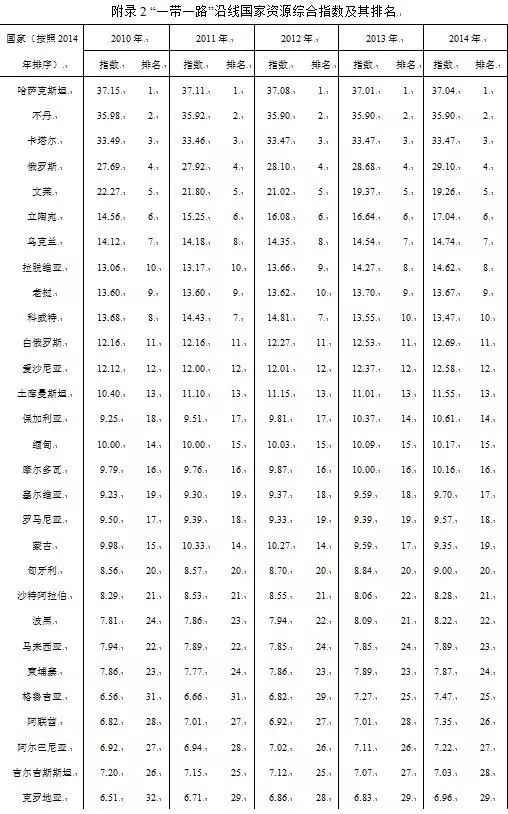


Source: index calculated by Emerging Markets Institute, Beijing normal University
[1] World Bank. Rising global interest in farmland: can it yield sustainable and equitable benefits? Washington DC: World Bank, 2010.
[2] The division of income groups in the world is based on (GNI), per capita in 2015 using the World Bank's Atlas method. Low-income groups range from $0 to $1,025, low- and middle-income countries from $1026 to $4,035, middle and high incomes from $4036 to $12475, and high-income groups from $12476 or more.
[3] Zhao Yan,Nazarbayev claims Kazakhstan has huge potential for Agricultural Development,CRI Online,2015-06-05,http://gb.cri.cn/42071/2015/06/05/8011s4987823.htm;Kazinform, 5 May, (reported by Hanama Mette Hazevowler)纳扎尔巴耶夫5日在总统府召开的政府扩大会议上表示,哈共有900 万公顷土地未被开发利用;Reported by Ye Xiaonan,中外知名人士纵论“一带一路”,互联互通让世 界共享机遇,People’s Daily Oversea Edition,19 December 2016, 02; http://paper.people.com.cn/rmrbhwb/html/2016-12/19/content_1736845.htm
[4] Food and Agriculture Organization of the United Nations. The state of food insecurity in the world: how does international price volatility affect domestic economies and food security. Rome: FAO, 2011.
[5] The Food and Agriculture Organization of the United Nations (FAO) provides that the world is the most dependent on grain imports in 2009-2011, so this part of the analysis is based on this time period.
[6] WCED. Sustainable Development and Water. Statement on the WCED Report“ Our Common Future” [J]. Water International, 1989, 14(3):151-152.